Stochastic vs Deterministic Surface Analysis
Stochastic and deterministic are two terms that are used more and more frequently to qualify modern surfaces. What is their meaning? How do they compare with roughness and waviness concepts? What influence do they have on surface function?
1. Classifying surfaces
Metrologists are used to classifying surfaces based on their roughness, on an axis between rough and smooth. A surface is said to be rough when its average wavelength, i.e. the lateral distance between two zero-crossings of the profile is short. Intuitively, a profile with many height variations per millimeter along X is considered as rougher than a profile with fewer variations. The amplitude of the profile variation is also a determining factor.
More difficult to understand is the influence of features or structures in the profile. A feature is an identified motif that is repeated on the surface. It can be a geometrical feature, such as a cylindrical pillar standing on a flat surface, or it can be shallower, looking more like an irregular bump.
Most classical parameters, such as Rq (or Sq), called field parameters, only characterize heights or amplitudes of the profile (or the surface). They use all points of the measured surface to calculate the parameter value. Even when they are associated with an L-Filter, they will usually fail to discriminate the influence of the feature shape on the function. In figure 1, the three profiles have the same Rq value although they have obviously different functions. The first one is perfectly sinusoidal, the second one has periodical rectangular grooves and the third one is more random although it is pseudo-periodical.
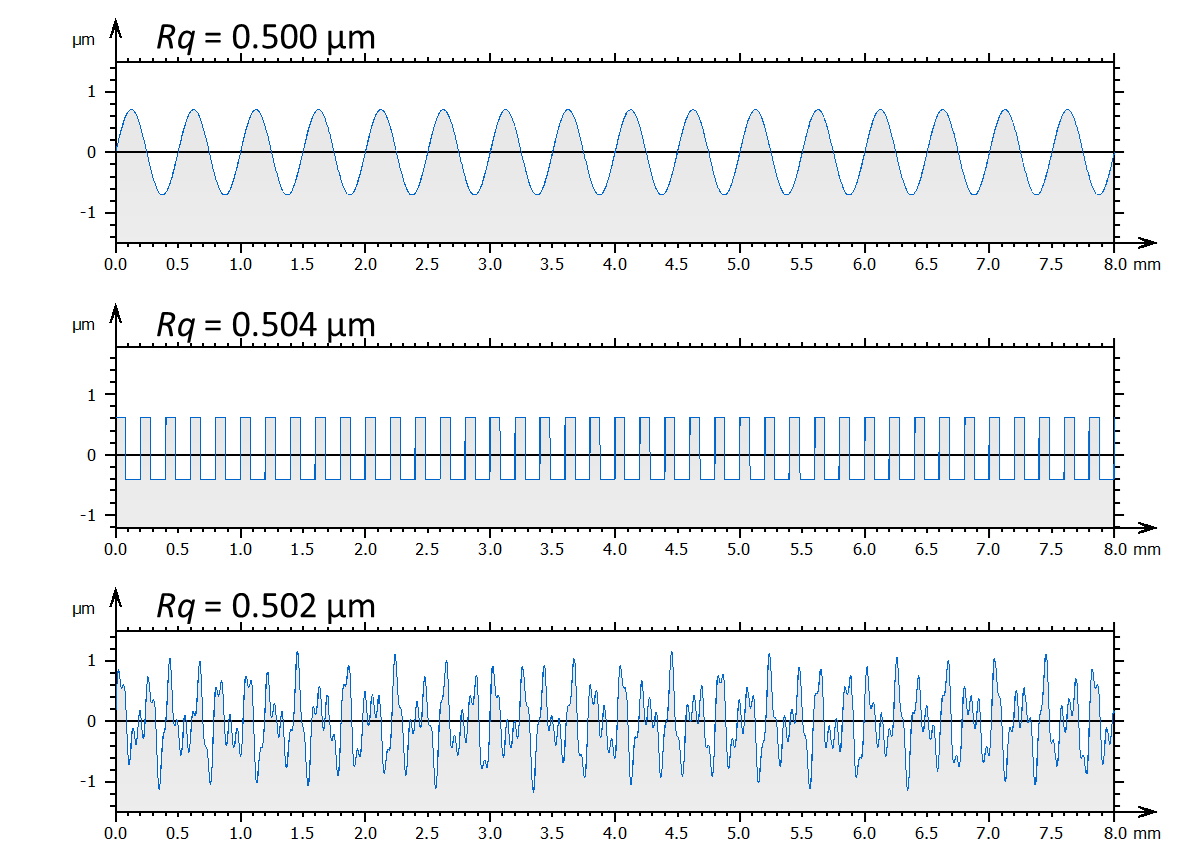
Figure 1. Three profiles with the same roughness value (Rq, L-Filter cut-off = 2.5 mm)
but different average wavelengths and different feature shape.
2. Is stochastic equivalent to rough?
Obviously, there is an intuitive logical link between stochastic and rough, between deterministic and smooth. However, the stochastic-deterministic axis, sometimes referred to as the Feature spectrum, is not the same as the rough-smooth axis. We can even consider that they are two orthogonal axes, forming a 2-dimensional graph in which we can pinpoint materials, machining processes or products (see figure 2).
Now, we have a tool to help us categorize surfaces. In the upper-left quadrant of figure 2, rough-stochastic surfaces are obtained by traditional machining processes. In the lower-left quadrant, smooth-stochastic surfaces are obtained by super-finishing or polishing, or by fluid-coating. In the lower-right quadrant, the smooth-deterministic surfaces are produced by molding or lithography to create micro-patterns. Last, in the upper-right quadrant, rough-deterministic surfaces contain features in a more natural or organic distribution. Many other surfaces or machining processes can be displayed in such a graph.
A third axis could even be implemented, to form a 3-dimensional graph where surfaces are a point in space, like a point cloud, leading to 8 categories. This third axis would be scale to highlight the multi-scale character of some surfaces that may have, for example, a smooth and stochastic behavior at large scales and a rough & deterministic behavior at small scales.
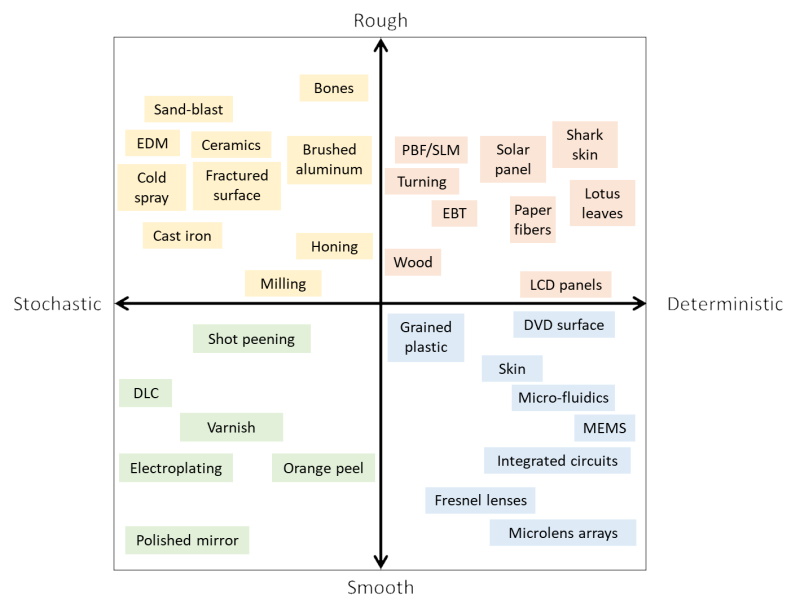
Figure 2. Categorization of machining processes & materials
using both stochastic-deterministic and rough-smooth approaches.
3. Why categorize?
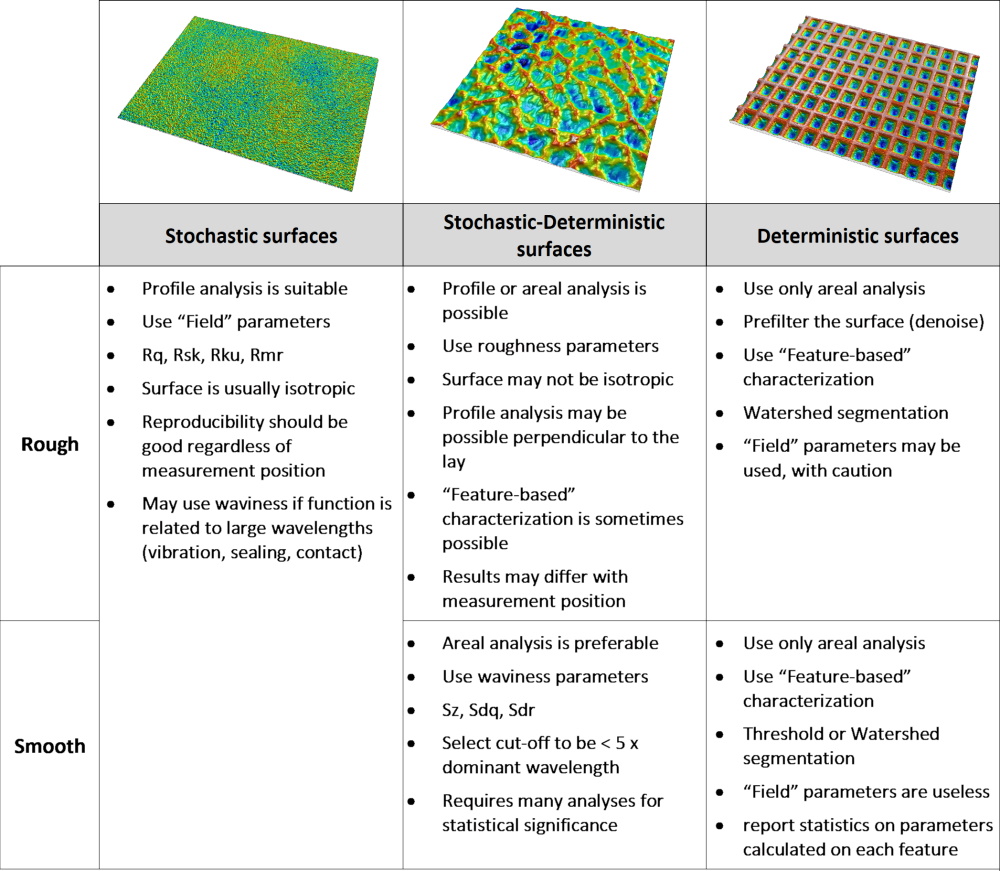
These categories can help users choose the right tools to analyze their surfaces. Stochastic surfaces can be characterized using statistical parameters taking into account all points (field parameters). They can usually also be correctly characterized by profilometry as they are isotropic surfaces. At the other end of the spectrum, deterministic surfaces have structures or features that must be characterized individually and then averaged over all features. They also require areal measurements.
4. Read more resources
- Areal field parameters
- How to characterize lateral features
- Areal Feature parameters
- About surface function
- Selected bibliography
- Surface metrology courses in video
See also surface analysis capabilities of MountainsMap® and the available optional modules.
5. Bibliography
- Feature-based characterisation of surface topography and its application, X Jiang, N Senin, P J Scott, F Blateyron, CIRP Annals, 70(2), 681-702
- Technological shifts in surface metrology, X Jiang, D Whitehouse, CIRP Annals, 61(2), 815-836