Particle analysis
![]()
![]()
![]()
![]()
![]()
![]() Studies tab
Studies tab ![]() Structural analysis
Structural analysis ![]()
![]() Particle analysis
Particle analysis
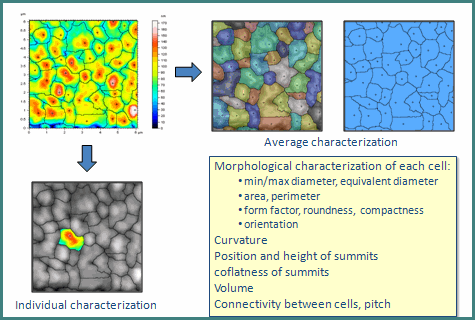
Detect, quantify and classify particles, pores, grains, and other image features (of any shape and size) having boundaries.
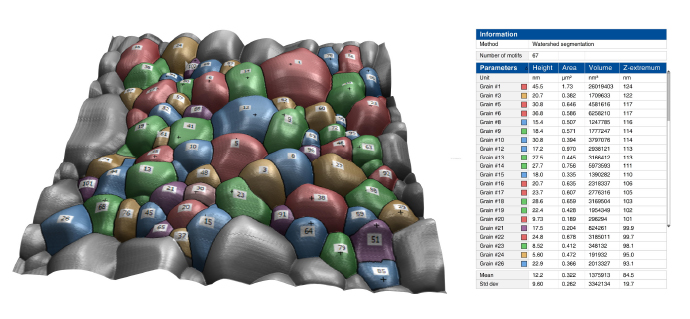
The study provides several feature detection methods (threshold segmentation, ISO 25178-2 watershed segmentation, edge detection, circle detection), a range of graphical representations, and classification tools.
Particle analysis is used in research and industry across many fields ranging from quality control of structured materials (metal alloys etc.) to characterization of nano-structure assemblies.
See also: www.digitalsurf.com/news/particle-analysis-in-mountains-8/
Vocabulary
Depending on the method or on the field of application, the following names may be used, for a feature:
Particle/Pore |
Object above/below a reference height (or intensity). Obtained using a threshold, or by segmentation with a gradient. |
Island |
Hill above a plane used as a threshold. |
Hill and its peak / Dale and its pit |
Portion of a surface ("motif") obtained by watershed segmentation as defined in ISO 25178-2. A dale corresponds to the concept of “catchment basin”. |
Hole |
Dark object on an image, or a group of non-measured points on a surface. Its content cannot be analyzed, only its horizontal characteristics (lateral size or area). |
Grain |
Used in metallography for crystal grains on a sample slice. |
Structure |
Geometric shape above or below the surface, for example on a microelectronic structure such as a MEMS. |
and also… |
▪Motif ▪Object ▪Shape ▪Cell ▪Fiber ▪Porosity ▪... |
There are two types of features:
|
Features above the background (protruding objects) |
|
Features below the background (receding objects) |
Most of the time, we will use the words "feature" or "particle", but keep in mind that in your field of application, other terms might be more appropriate.
Preparing the surface before detection
1.Inspect the surface and get an idea of the features you want to detect (particles, pores, grains etc.). This will help you choose the right detection method.
2.Level the surface if necessary.
Note: A flat and horizontal background is especially important when using the Threshold detection method.
3.Remove the noise if necessary. You can filter the surface, and use the operators in the Correct group.
Detection methods
|
Threshold detection |
Detect particles that are standing out clearly on a flat background, using one or two thresholds. |
|
Watershed detection |
Detect contiguous dale motifs or hill motifs using watershed segmentation as defined in ISO 25178-2, and fully segment the surface. |
|
Edge detection |
Detect features on an uneven background, using watershed segmentation, after the application of an edge detection filter. |
|
Circle detection |
Detect small round particles, including overlapping ones, even on a noisy background. |
![]() Tip: For application examples of some of the detection methods, have a look at our Templates:
Tip: For application examples of some of the detection methods, have a look at our Templates:
![]() Help tab
Help tab ![]() Templates
Templates ![]() [XXX] - Particle analysis - [XXX]
[XXX] - Particle analysis - [XXX]
Threshold detection 
Detect particles that are standing out clearly on a flat background, using one or two thresholds.
Basic and fast method to detect particles or pores on a surface with a flat and horizontal background. The roughness of the surface must be smaller than the height of the particles (or smaller than the depth of the pores). The particles should have similar heights.
Using the analogy of water flooding a landscape, particles are the islands left when the landscape is flooded up to the chosen threshold. Pores are holes below the water surface.
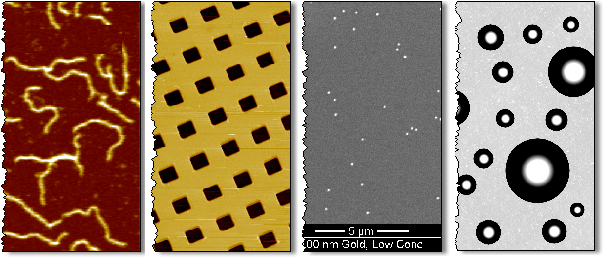
Examples of typical surfaces for which the Threshold detection method can be used.
Courtesy of Dr. Kai Dirsherl, Danish Fundamental Metrology
Note: When using two threholds, you may work on surfaces having particles and pores at the same time.
Watershed detection 
Detect contiguous dale or or hill motifs using watershed segmentation as defined in ISO 25178-2, and fully segment the surface.
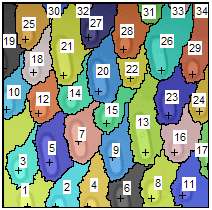
A surface is divided or segmented into motifs by a segmentation algorithm. The algorithm calculates watersheds that divide or partition hill or dale motifs and locates their peaks and pits.
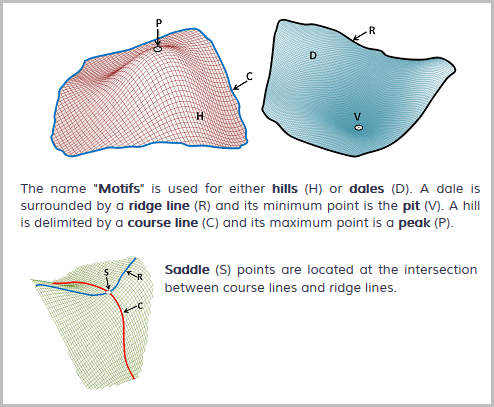
Vocabulary:
|
Peak on a hill |
|
Pit in a dale |
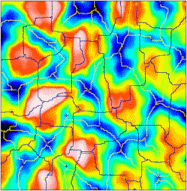
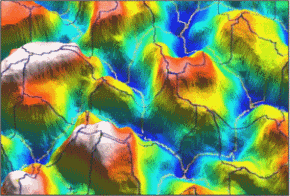
The software shows the watershed lines that divide the hill or dale motifs, together with the peaks or pits (represented by crosses). The colors of watershed lines and peaks/pits are user-selected.
|
|
On the example, peaks and course lines are shown in yellow. Pits and ridge lines are shown in dark blue. |
|
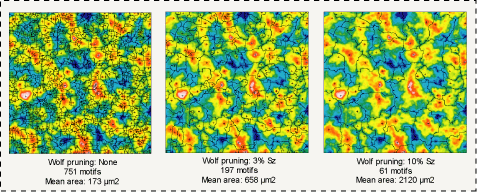
Segmentation takes into account user-selected filtering and thresholding or pruning criteria. Filtering (in the range 3x3 to 13x13) is used to reduce very local peak/pit detection. Segmentation is controlled by minimum height and minimum area criteria for motifs.
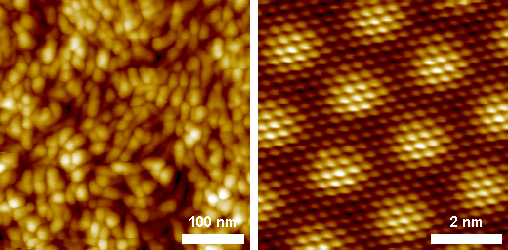
Examples of typical surfaces for which the Watershed detection method can be used.
Courtesy of Danish Fundamental Metrology (left image), University of Interdisciplinary Nano Science Center (iNANO) and Institute of Physics and Astronomy, University of Aarhus (right image).
Settings (Watershed detection and Edge detection)
Pre-processing |
The smoothing pre-processing filter is a noise reduction filter allowing you to neglect very local peaks, by averaging the heights using neighboring points. |
Pruning criteria |
A “Wolf pruning” algorithm helps you eliminate insignificant motifs by merging them into larger ones. |
Edge detection
Detect features on an uneven background, using watershed segmentation, after the application of an edge detection filter.
This method can be used to detect dispersed features on a surface with a wavy or uneven background, or when the features have different heights. The method can also be used if the features are connected, i.e. not clearly separated.
It works also for detecting grain boundaries, of polished metal or ceramic surfaces for example.
A derivative of the surface (i.e. a gradient filter) is used to calculate the outline of the detected motifs.
This method allows you for example to automatically detect and analyze spherical motifs on microlenses.
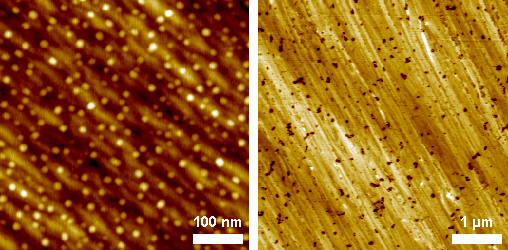
Examples of typical surfaces for which the Edge detection method can be used.
Circle detection
Detect small round particles, including overlapping ones, even on a noisy background.
This method is designed for detecting round or spherical particles which are difficult to detect or separate using the other methods (adjacent or overlapping particles, or particles with a weak contrast). It is particularly useful on SEM images, especially in presence of noise.
Note: The particles should have similar sizes. The calculation time increases with the range of circle diameters that you look for.
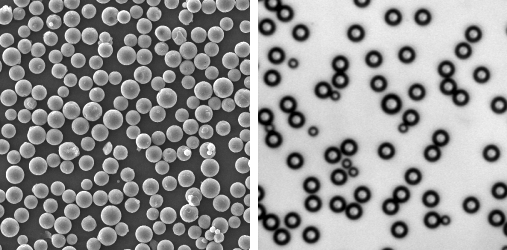
Examples of typical surfaces for which the Circle detection method can be used.
Options for refining the detected particles
Separate grains (merge or split grains)
This dialog allows you to merge or split the detected features. More information...
Morphological correction
This dialog allows you to dilate or to erode the detected features. More information...
Refine the detection
|
Refine |
Refine the detected particles (filling of particle holes, smoothing of contours...). |
This dialog allows you to:
▪Remove particles on edges
▪Remove small particles with an area smaller than the defined area
▪Fill holes in particles
▪Smooth the contour
Display options
|
Overlay view |
Visualization of the image's particles in pseudo-colors on the surface. |
|
|
Particles view |
Visualization of the particles on a monochrome background. |
|
|
Colored particles |
Visualization of the particles using colored cells. |
|
|
Possibility to select the transparency for the colors.
|
||
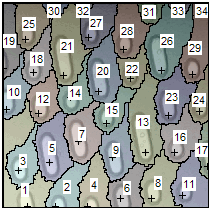
Note: When using the Watershed detection method: The motifs are numbered depending on their height (Z-extremum), starting with the biggest value.
Sphere fitting and spherical caps
|
Spherical caps |
Calculate and show spherical caps contained in the particles. Add sphere parameters to the list of available parameters. Spheres can be fitted to motifs and spherical caps can be shown, for example in studies of microlens arrays. |
Skeletonizing
|
Skeletonize |
Calculate skeletons on particles. Add skeleton parameters to the list of available parameters. |
Using a different layer for detection and for calculation
|
Detection layer |
Select the layer used to detect particles. |
|
Calculation layer |
Select the layer used to calculate the parameters. |
Note: The X- and the Y-axes of the two layers must have the same size and use the same unit.
The different layers can be:
▪Layers composing a multilayer surface.
▪Layers composing a "Surface+Image" studiable.
▪Two measurements done on the same surface, under identical conditions.
▪The same surface, after the application of a pre-treatment (operator...).
▪...
Results
Selecting the results to show
|
Select parameters |
Open a dialog box to select the parameters or results to show.
Note: A set of parameters is calculated by default, but you can select more or other parameters.
|
Tip: You can select all items ( Ctrl + A), continuous items ( Shift + Click), or discontinuous items ( Ctrl + Click).
When the multiple selection of items is done, click on the checkbox in front of one of the items to select/deselect all items of the multiple selection.
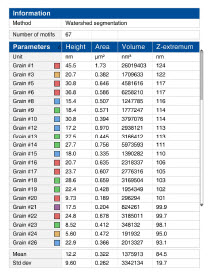
Available results
Parameter |
Explanation |
Coverage |
Ratio between total area of analysed grains and total area. |
List of parameters for particles and shapes and their definition...
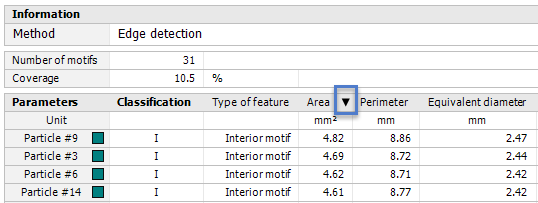
 Tip - Sorting the particles
Use the arrows in each column header, to sort the entries in descending or ascending order.
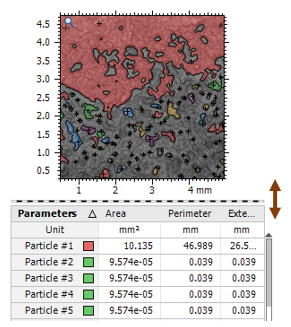
 Tip - Resizing the table
In order to increase the size available for the table: Use the split bar ![]() to re-dimension the size of the graph zone and the results zone.
to re-dimension the size of the graph zone and the results zone.
Display modes
|
Statistical results |
Calculate statistical results from the individual values. Note: Use |
|
Individual results |
Show individual results for each element.
|
Note: You can show individual and statistical results at the same time.
 Tip - Interactivity
Independently of the chosen display options, it is possible to select one or several individual motifs. The corresponding results are automatically selected in the table.
Note: You can also select a result in the table, in order to find the corresponding particle in the image.
"Single particle" mode
|
Single particle |
Select a single particle with the mouse, and show the corresponding results.
|
|
|
Possibility to select a particle by its number. |
||
 Tip - Deleting particles
You can select one or several particles in the image, or in the table, and use the Del key to delete them.
Example: If the background is considered as a very big particle, you might want to delete it. The
 Tip - Statistical studies over series of results
When your document contains results calculated over a series of studiables or over a series of elements, you can use a statistical study over results. A statistical study allows you to graphically represent the numerical results generated by the current study (Motifs study):
▪Control chart.
▪Scatter plot.
▪Histogram.
Exporting the image
![]() Export image
Export image ![]()
|
Export frame as image |
Export the content of the frame as a bitmap image, using the current size. |
|
Export studiable as image |
Export the studiable only, as a bitmap image, using the original resolution of the source studiable (1 point = 1 pixel).
|
|
Generate as dynamic image |
Generate as dynamic image studiable of the study. Add an image studiable of the current study to the Workflow. The image studiable is dynamic and dependent on its source study. |
 Tip - Overlaying particles as texture
Use Export frame as image to export an image of the surface in "Overlay view". You can then load this image in the software, and use it as Custom texture in a 3D view study.
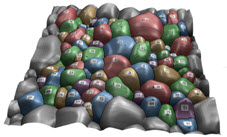
Classification
Tips
Full screen / maximizing the frame
|
Full screen F11 |
Show the study in full screen mode. |
Showing results on the right side
|
Select parameters |
|
Show results on right side |
Show the table listing the parameters and the results on the right-hand side of the study. |
See also...
▪More information (and a video) on the Digital Surf website: www.digitalsurf.com/news/particle-analysis-in-mountains-8/
