How can I characterize lateral features?
Most surface texture parameters are related to heights. But in some applications lateral features and their spacing are as (if not more) important. Which parameters should be used to characterize these properties and how is this done ?
1. Height parameters are the most common
Common roughness parameters such as Ra, Rq, Rsk (and their areal equivalents Sa, Sq, Ssk) integrate heights calculated from the reference surface. Even material ratio parameters such as Rmr, Rdc, Rk (or Smr, Sdc, Sk) are based on the Abbott-Firestone curve, built from the height or depth distribution. What is more, these parameters take into account all the points of the profile (or surface): they are field parameters. They do not tell us anything about the lateral position of the points nor about features of interest on the surface.
The only lateral information that is used in roughness analysis is the filter cut-off:
- Either the small-scale cut-off λs or the main cut-off λc used to separate roughness from waviness on a profile
- or the areal equivalent with S-Filter and L-Filter applied to produce scale-limited surfaces.
However, some workpiece functions rely on the lateral size of structures or features on the surface or on the lack of periodicity on the surface. For example, the grained surface of a laptop case is important for its feeling and aspect. The perceived quality depends on the average height of grains but also, and probably more importantly, on the lateral distribution of the grains on the surface (their relative distance) or their lateral size (diameter or dimension).
On the other hand, a shaft rotating at high speed should not exhibit periodical variations on its surface otherwise it creates noise and generates heat, likely resulting in failure after a certain time. If the amplitude of the noise depends on heights, its frequency depends on the wavelength of the period.
2. Spacing of elements
As far as profiles are concerned, very few parameters are designed for characterizing lateral sizes.
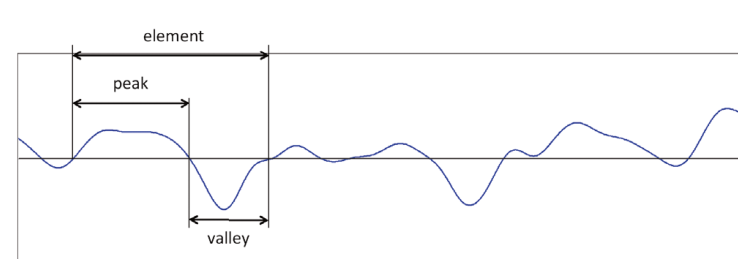
One well-known example is RSm, mean spacing of elements, defined in ISO 4287. An element is defined on a profile as a peak followed by a valley or a valley followed by a peak. Both peaks and valleys are defined between two zero-crossings, on the mean line.

To avoid taking into account small peaks or valleys resulting from noise or roughness, vertical and lateral discrimination is introduced. For example, the second element on the example profile will count only as one peak by joining the two humps together because the valley in between is too small (see below).

By calculating the mean of all element lengths, we can estimate the mean spacing of a periodical structure. This is also useful on semi-periodical profiles, where the dispersion of element lengths is reduced by the averaging process. This parameter is therefore useful for specifying a dimensioning tolerance along the surface (lateral characteristics) instead of in heights.
However, the initial definition of RSm is somewhat ambiguous, because it is specified on a sampling length, and because the use of discriminations is not clearly explained. Each manufacturer has implemented their own understanding of this parameter so it is frequent to have discrepancies in RSm values on semi-periodical profiles or more frequently on non-periodical profiles.
RSm is given in length units on the X axis, usually in millimeters. RSm can be used to assess the length of a periodic structure. In particular, it is often used to calibrate the lateral amplification coefficient of scanning profilers with the help of a grating or a sinusoidal or triangular calibration artefact (e.g. Rubert & Co models 521 or 525).
3. Spacing of motifs
R&W motifs are defined in ISO 12085. They are usually referred to as French motifs. The beauty of this method is that it decomposes the profile into motifs that are a peak-valley-peak triplet. Two adjacent motifs share one peak.

After a pass to reduce non-significant features, motifs are characterized with parameters such as R, mean height of motifs, or AR, mean length of motifs. The latter is similar to RSm and should give the same value on periodical profiles. An interesting complement is the parameter SAR which is the standard deviation of all motif lengths. It provides an indication on whether the profile is periodical, semi-periodical or non-periodical.
Motifs can also be calculated on the waviness profile (envelope profile) in which case the corresponding parameters are W, AW and SAW.
4. Spectral analysis
Periodical structures can also be analyzed with Fourier analysis. A periodic structure will generate a high spectral peak which can be characterized, for example, by the Averaged Power Spectral study in MountainsMap®.
5. What about lateral characteristics on a surface?
Most textured and structured surfaces cannot be accurately studied with profile measurements and require areal measurements parameters. Surprisingly, the only official areal parameters that are purely lateral in ISO 25178-2 are Sal and Str. The isotropy parameter Str indicates whether the surface is homogeneous in all directions or has dominant directions.
A structured surface will tend to have high Str values. Sal is called autocorrelation length and is supposed to characterize the size of the texture cell that best represents the lateral surface characteristics. However, this parameter is not understood very well and not really supported by proven studies.
6. Feature parameters
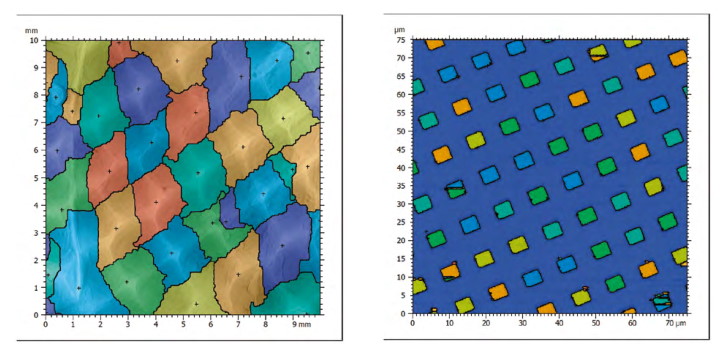
Feature parameters are calculated from specific features (points, lines, areas) extracted from the surface by a segmentation algorithm defined in ISO 25178-2 and ISO 16610-85. In particular, hills or dales are the areal equivalent of motifs, i.e. an area enclosed by a contour that represents an identified feature of the surface. This can also be a structure when using a gradient prefilter.

The two examples above show texture cells (left) or structures (right) detected by the watershed algorithm. Motif characteristics can be evaluated individually or as a whole with mean values. Several parameters are of interest here: area and diameters. The ISO standard only mentions Sha (area of hills) and Sda (area of dales) but other parameters can be calculated such as the equivalent diameter or the min/max/mean diameter. They are all provided in MountainsMap® as part of the Particles Analysis module.
7. Conclusions
ISO standards offer plenty of parameters based on heights, material ratio or slopes, but very few for characterizing lateral features such as size or diameter. There is probably room for improvements in order to offer metrologists and designers the tools for a better specification of manufactured parts. Segmentation allows the detection of individual features that can be analyzed in the x,y plane from their contour. Many lateral quantities can be derived from the contour and inter-feature characteristics can also be calculated, such as pitch.
Resources
ISO 21920:2021: GPS – Surface texture: Profile method – Definitions and parameters
ISO 4287:1996: GPS – Profile method - Terms, definitions and surface texture parameters
ISO 12179:2000: GPS – Surface texture: Profile method - Calibration of contact (stylus) instruments
ISO 25178-700:2010: GPS – Surface texture: Areal - Calibration and measurement standards for contact (stylus)
ISO 16610-85:2013: GPS – Filtration – Areal morphological – Segmentation
F BLATEYRON, Feature parameters, chapter 3 in Characterisation of areal surface texture, published by Springer
N SENIN, L BLUNT, Characterisation of individual areal features, chap. 8 in Characterization of Areal Surface Texture, Springer
J BLANC et al, Surface characterization based upon significant topographic features, J of Physics, conf series