The first manufacturers of areal surface texture measurement instruments initially proposed characterization methods that were mainly based upon a simple extrapolation of 2D methods. In the absence of official documentation, the manufacturers made up solutions that were more or less felicitous, with surface parameters sometimes calculated as the simple mean of profile parameters evaluated for each line on the surface, or for radial profiles extracted from a circle with its origin at the centre of the image.
The naming rules for the parameters were also derived from the 2D parameters (sRa, sWa...) and were calculated using proprietary algorithms leading to different values on different instruments. Nonetheless good practices were later disseminated, notably thanks to publications by Pr. Stout and his collaborators at Birmingham [STOUT 1993], and with the release of DigiSurface software on Macintosh in 1993, developed by Digital Surf and later adapted for Taylor Hobson's Form Talysurf under the name Talymap. Later, release of MountainsMap in 1996 and publication of the SurfStand report [BLUNT 2003], contributed to establish standard ways to calculate areal surface texture parameters. MountainsMap® version 5.0 was the first commercial package to offer, in 2007, the complete set of field parameters defined in the draft ISO 25178.
Details on field parameters
can be found in [BLATEYRON 2013a] (chapter 2 of [LEACH 2013]).
1. Naming rules for 3D parameters
In the ISO 25178 standard, all areal parameters start with the upper case letter S or the upper case letter V. In contrast with naming rules used with profile parameters, prefixes of the areal parameters do not reflect the nature of the surface, distinguishing between roughness and waviness. For profiles, we have Pa, Ra and Wa; For surfaces, we only have Sa, which can therefore be a parameter of roughness, or waviness, or calculated on the primary surface, depending upon the pre-filtering that is carried out before the parameter is calculated. This decision is based upon the multiplicity of processing and filtering methods that are available to metrologists for extracting information from a surface [ISO 16610]. These processing methods do not necessarily separate the surface texture into two components that are roughness and waviness but in certain cases alter the surface in a more subtle manner.
2. Amplitude parameters
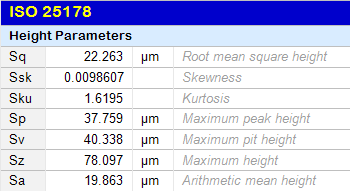
Most of the profile parameters defined in ISO 4287 have a mathematical expression that can easily be extended to surfaces. For example, Sq is simply an extension to a plane of the equation of Rq that is defined for a line:


Sa, Sq, Ssk, Sku, Sp, Sv, etc. can therefore be defined straightforwardly in the same way.
Parameter equations use integrals instead of sums because they represent the definition for continuous case. Obviously, practical implementations use discrete data and various approximations to the instegration. No recommended method is given, each algorithm being characterized by an uncertainty budget.
Besides the above parameters that can easily be extrapolated, certain parameters pose problems. Rz is defined in ISO 4287 as the maximum height on a sampling length and is averaged on the number of sampling lengths contained in the evaluation length. In general, Rz is smaller than Rt. This parameter has known numerous definitions, first of all defined in ISO 4287 (1984) as the ten points height, then modified in 1997, and it has remained confusing notably because of its similarities with the Ry and Rmax parameters.
It is worth noting that Sz, as defined in ISO 25178, is simply the maximum height from the highest point to the deepest valley, as St was once defined. Therefore St disappears from the standard! The absence of this well-known parameter may create confusion for some users!
3. Spatial Parameters
A surface is said to be isotropic when it presents identical characteristics regardless of the direction of measurement. This is the case, for example, for surfaces with a random surface texture that do not have any texture that stands out. This type of surface is unhappily fairly rare and most of the surfaces encountered in industry have an oriented surface (turned, ground or brushed surfaces) or a periodic structure (EBT impacts, grained plastics). In this case the surface is said to be anisotropic.
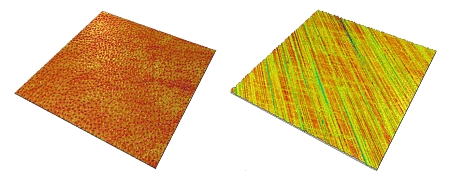
Isotropic surface (left) - anisotropic surface (right)
The isotropy of a surface can be determined and quantified by tools based upon the Fourier transform and autocorrelation.
Autocorrelation is a function described by the following equation:

This function makes it possible to generate an image on which it is possible to measure characteristic quantities.
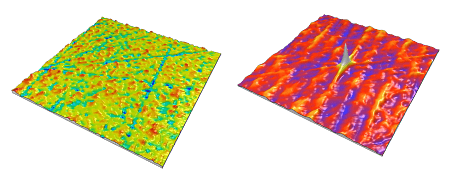
surface (left) - autocorrelation (right)
The autocorrelation image always includes a central peak with normalized amplitude of 1.0. In certain cases the image includes secondary peaks that indicate a certain correlation between portions of the surface with the surface itself. This is the case with surfaces including periodic or pseudo-periodic motifs. Indeed the form of the central peak is an indicator of the isotropy of the surface.
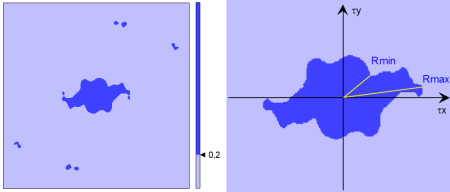
In order to characterise the form of the central peak, one carries out thresholding s of 0,2 and then one quantifies the central zone of the image corresponding to the portion of the peak that remains after thresholding.
In this way it is possible to construct a parameter that will be an indicator of surface isotropy:
Str, texture aspect ratio

The minimum and maximum radii are sought on the image of the central lobe (generated by thresholding the central autocorrelation peak). If the surface presents the same characteristics in every direction, the central lobe will be approximately circular and the min and max radii will be approximately equal. If the surface presents a strong privileged orientation, the central lobe will be very stretched out and the max radius will be much greater than the min radius.
where Rmin and Rmax are the min and max radii calculated with respect to the perimeter of the central lobe. The radii are calculated from the coordinates of point (tx,ty) on the perimeter. Note that the threshold value of 0,2 is a default value but that for certain applications it can be advisable to choose a higher or lower value, notably to assure that the central lobe is well defined and does not touch the edges of the image. The Str parameter takes a value between 0 and 1, and is unitless. It can also be expressed as a percentage between 0% and 100%. An isotropic surface will have Str close to 1 (100%) while a strongly anisotropic surface will have Str close to 0.
The value Rmin equally provides a useful indication of the spectral content of the surface. A surface that is essentially made up from spectral components with long wavelengths yields a high Rmin, and inversely. Hence the parameter Sal is defined as follows:
Sal, fastest decay autocorrelation length Sal = Rmin
This parameter is expressed in µm.
Another useful tool is the polar spectrum. The Fourier spectrum, when it is integrated in polar coordinates makes it possible to determine the privileged direction of surface structures. The polar spectrum takes into account the power spectrum of the surface in each direction. The angle with the largest power spectrum corresponds to the privileged texture direction.
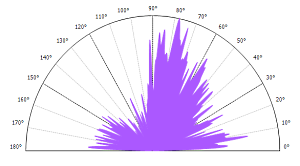
The representation of the polar spectrum clearly shows the privileged directions. The angle corresponding to the polar spectrum maximum makes it possible to define the Std parameter:
Std, texture direction
This angle is expressed in degrees, anticlockwise.
4. Hybrid Parameters
Hybrid parameters use both height and lateral information. They are amongst the most interesting parameters in many applications (more than the simple height evaluation, such as Sa).
Sdq, Mean quadratic slope
This parameter calculates the local slope on each triangle of the surface grid, and does the same summation as for Sq but replacing heights Z(x,y) by the calculated slopes. This parameter is given in µm/mm or in µm/µm or is even unitless. It is also possible to convert the slope in an angle using the arctangent. Sda caracterizes the complexity of the surface. The faster the texture is changing (high variation in Z within a short lateral spacing), the more complex the surface. On the contrary, a smooth and flat surface will offer a very small Sdq.
Another useful parameter for characterizing surface complexity is Sdr.
Sdr, Developed Area
This parameter calculates the area of each individual triangle of the surface grid and sums them out to define the curvilinear area that follows each asperity and texture element of the surface. This area is divided by the horizontal area (the rectangular support), in order to tell how much the surface differs from an horizontal plane. As these values are usually very close to 1,000, the parameter gives the excess of area from 1,0. A Sdr of 3,5% corresponds to a developed area 1,035 larger than the projected area.
Sdr is given in %. The higher the value, the more complex the surface. A value close to 0% means a flat and smooth surface.
This calculation has a link with the Scale-sensitive analysis and Sdr corresponds in principle to the value of "area-scale" for the smallest scale.
The basic set of amplitude parameters is included in all Mountains® products. Spatial, hybrid and functional parameters are offered with the Advanced Topography optional module and are included in MountainsMap® Premium.