Scale-Sensitive Fractal Analysis
Scale-Sensitive Fractal Analysis (SSFA) is an optional module of Mountains® software that allows a multi-scale analysis of surfaces, particularly useful for applications such as adhesion, friction, contact, wear, etc. This page provides an introduction on what SSFA is all about and how to use it.
1. What is fractal analysis?
We all learned at school that geometrical objects are sorted by the number of coordinates required to describe them. A line segment is 1-dimensional, a plane is 2-dimensional and a cube is 3-dimensional. However, in the real world, lines and surfaces may be more complicated than that.
Benoit Mandelbrot, the American-French-Polish mathematician, intoduced a new branch of mathematics where geometrical dimensions could be fractional instead of integer. This theory had many interesting applications in physics, economy and even the arts. The fractal dimension was found to be an interesting parameter to describe physical surfaces, and especially engineering surfaces.

A rough surface is like a microscopic mountainous surface, and its fractal dimension can be seen as an attribute characterizing its complexity. A very smooth and planar surface will have a fractal dimension close to 2.0, but a ceramic surface, which features many pores and cavities, will have a higher value, closer to 3.0 than 2.0.
The work of Mandelbrot applied to engineering surfaces was developed in particular by Professor Christopher Brown of Worcester Polytechnic Institute (WPI) who introduced length-scale and area-scale analyses, together with several other parameters and statistical methods to establish functional correlations and discriminations.
These techniques are designated by the acronym SSFA – Scale-Sensitive Fractal Analysis and are also sometimes referred to as Geometric Multiscale Analysis.
2. Scale-Sensitive graphs
When using length-scale analysis, a line-segment of fixed length (the reference scale) is used as a ruler to measure the actual length of a profile (or a surface line). The cumulated length divided by the horizontal length is called relative length. This value is between 1.0 and 2.0
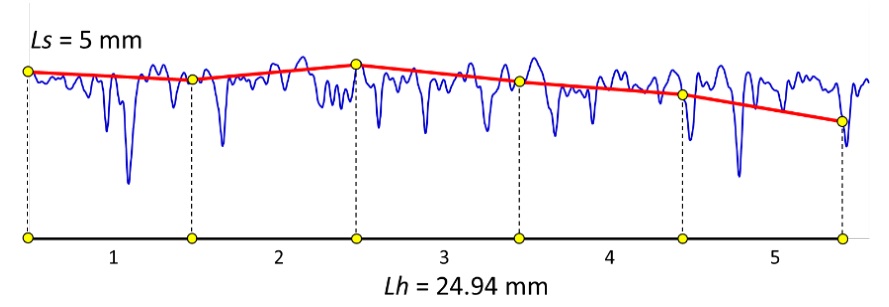
In the example above a segment of 5 mm length is used to measure a profile. We can fit 5 segments into a horizontal length of 24.94 mm. The relative length is therefore 25.0/24.94 = 1.0024.
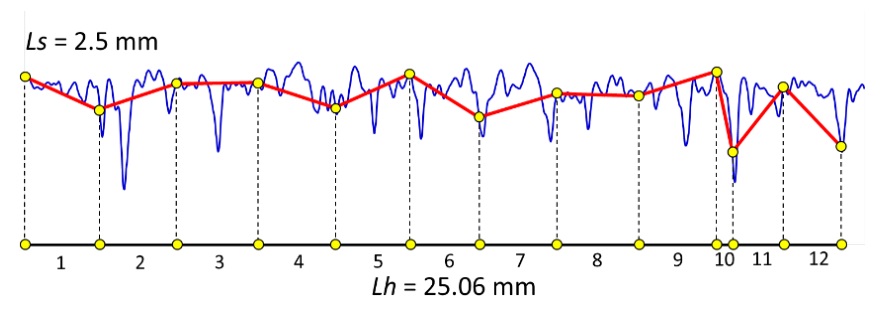
However, if we use a segment of 2.5 mm it is possible to fit 12 segments into a horizontal length of 25.06 mm, which gives a relative length of 1.197. In other words, the smaller the segment, the longer the measured length and the higher the relative length.
The measure is repeated with different segment lengths and a graph is drawn: log(relative length) in function of log(scale). The smaller the ruler, the larger the relative-length, as seen in the following graph.
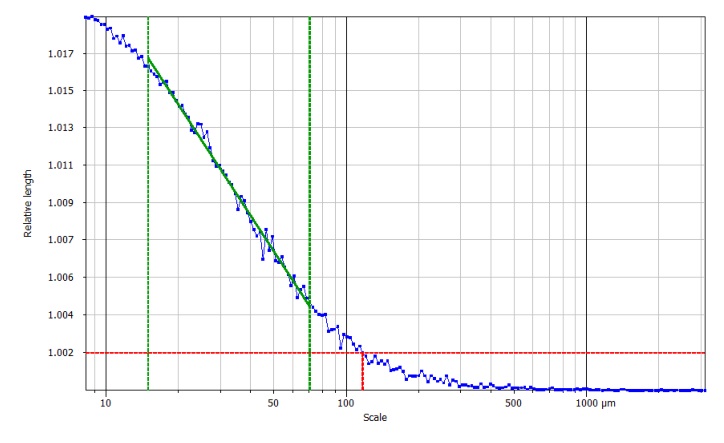
On this graph, large scales are on the right (towards the size of the profile) and small scales are on the left (towards the size of the spacing distance). It means that waviness (smooth components) is on the right, and roughness is on the left. A threshold is set to find the smooth-rough crossover (SRC) which gives the scale of transition between large scales where the surface is analyzed from too far away (its fractal dimension is close to its Euclidian dimension) and scales where the fractal dimension really does describe the behavior of the surface. The central part, between the two green lines, is almost linear and its slope is used to calculate the fractal dimension and other parameters.
3. Can a surface data be analyzed using the same method?
The answer to this is yes, since relative length can be calculated on lines or on columns of the surface and the average value of relative length used to build the graph.
Alternatively, the area-scale method can be used, where triangular tiles of a fixed area are used to calculate the actual area of the surface, and the relative area is obtained by division with the projected area. A similar graph is obtained and the same parameters can be calculated. In that case, the scale is the area of the tile used as a pseudo-ruler.
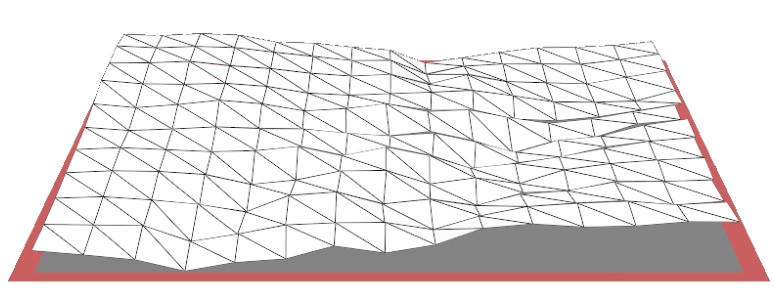
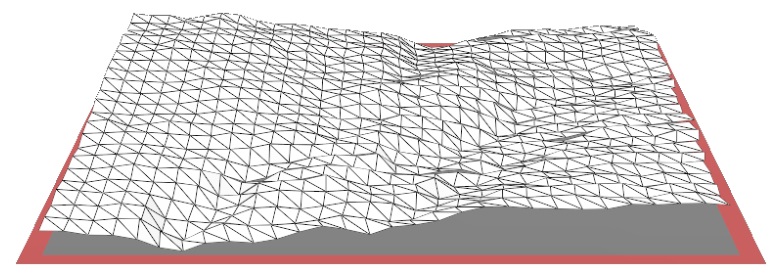
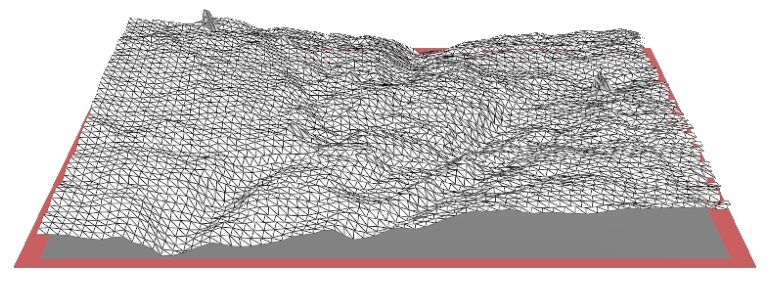
Above. Three tiling exercises with different tile sizes.
4. Related parameters
These parameters are used in various fields of metrology and research such as the study of adhesion strength, fracture analysis, thermal-spray coating, tool wear etc. They are all calculated from the graph itself (length-scale or area-scale)
Smooth-rough crossover: scale of separation between the smooth domain and the rough domain. This parameter is very useful for applications related to friction and contact.
Maximum relative length/area: the value at the finest scale. On a surface, this value converges towards the ISO parameter Sdr.
Fractal dimension (Dls / Das): calculated on the linear part of the graph from the slope of the fitted line segment.
Complexity (Lsfc / Asfc): characterizes how much the surface is more complex than a Euclidian plane (or a profile from a Euclidian line). This concept is somewhat similar to the ISO parameter Sdq.
Scale of maximum complexity (Smfc): scale at which the surface exhibits its highest complexity. This parameter can be used in correlation studies with functional attributes.
Regression coefficient R²: a high value confirms the accuracy of the complexity value.
Heterogeneity of complexity: where the surface is analyzed by blocks (for example 5x5) and the dispersion of complexity is calculated.
MountainsMap® also offers additional parameters initially developed for Dental Microwear Texture Analysis by Prof Rob Scott and Prof Peter Ungar and made available in the ToothFrax software: epLsar, HAsfc, etc.
One advantage is that these parameters are calculated within a scale range where the function is found to be active. This scale-limited approach is more powerful than calculating a field parameter on a surface with a default filter.
The parameters listed above are described in ISO 25178-2:2021, clause 4.7 and are also part of ASME B46.1:2002.
5. Where can I find the tools?
These parameters can be found in MountainsMap® optional module Scale-Sensitive Fractal Analysis module. This module implements most of the methods that were available in Sfrax and ToothFrax software packages.
Additional resources
These references are provided for info, to help users understand the benefit of this method on some applications.
About length-scale and area-scale analyses:
- BROWN C.A. (1993) Fractal Analysis of Topographic Data by the Patchwork Method, Wear, 161:61–67
- BROWN C.A., MEACHAM B. (1994) Tiling strategies in the patchwork method and the determination of scale-area relations, Fractals, 2(3):433-436
- BROWN C.A. et al. (1996) Scale-Sensitive Fractal Analysis of Turned Surfaces, CIRP Annals, 45(1):515-518, Elsevier
- PEDRESCHI F. et al. (2000), Characterization of food surfaces using scale-sensitive fractal analysis, J Food Proc Eng, 23(2):127-143
- BROWN C.A., SIEGMAN S. (2001) Fundamental Scales of Adhesion and Area-Scale Fractal Analysis, Int J Mach Tools Manuf, 41(13-14):1927–1933
- JORDAN S.E., BROWN C.A. (2006) Comparing texture characterization parameters on their ability to differentiate ground polyethylene ski bases, Wear, 261(3-4):398-409
- BROWN C.A. (2013) Areal fractal methods, in Leach: Characterization of areal surface texture, Springer
- CALANDRA I et al. (2022) Surface texture analysis in Toothfrax and MountainsMap® SSFA module: Different software packages, different results?, Peer Community Journal, Volume 2
About dental microwear texture analysis:
- SCOTT R.S. et al. (2006) Dental microwear texture analysis: technical considerations, J Human Evol, 51(4):339-349
- UNGAR P.S., SCOTT R.S. (2008) Dental microwear analysis: Historical perspectives and new approaches, Tech Appl Dental Anthrop, Cambridge Univ Press
- SCHULZ E., CALANDRA I., KAISER T. (2010) Applying tribology to teeth of hoofed mammals, Scanning, 32(4):162-182
- KRUEGER K.L., UNGAR P.S. (2012) Anterior Dental Microwear Texture Analysis of the Krapina Neandertals, Cent Eur Geosci, 4(4):651-662
- ARMAN S.D. et al., (2016) Minimizing inter-microscope variability in dental microwear texture analysis, Surf Topogr: Metrol Prop, 4:024007
- SCHMIDT C W, et al. (2026) Distinguishing dietary indicators of pastoralists and agriculturists via dental microwear texture analysis Surf Topogr: Metrol Prop, 4:014008
- DESANTIS L R G, (2016) Dental microwear textures: reconstructing diets of fossil mammals Surf Topogr: Metrol Prop, 4:023002
About fractals:
- Mandelbrot B.B. (1977) Fractals: form, chance and dimension, W.H. Freeman, 978-0716704737
- Mandelbrot B.B. (1982) The fractal geometry of Nature, W.H. Freeman, 978-0716711865
- RUSS J.C. (1994) Fractal surfaces, Springer, 978-1489925787
- SAHOO P., BARMAN T., DAVIM J.P. (2011) Fractal analysis in machining, Springer, 978-3642179211